

Key Takeaway
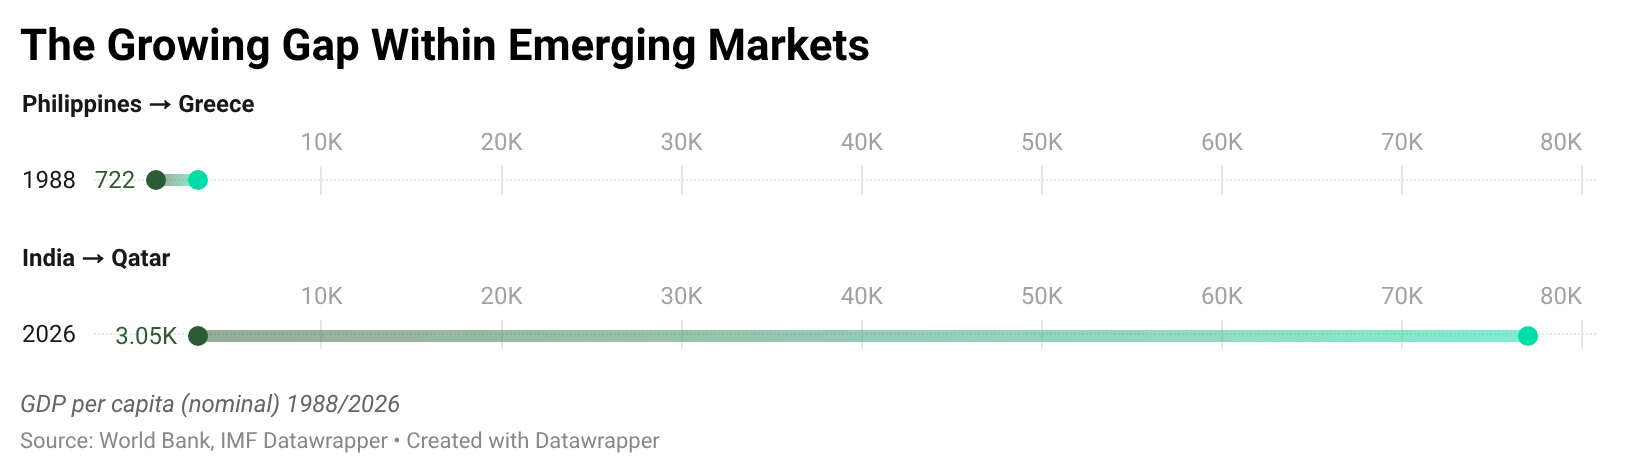
• The gap between the richest and poorest countries sharing the “emerging markets” label has grown from roughly 10x in 1988 to 25x today: Qatar at $77,000 GDP per capita, India at $3,050.
• Emerging markets now account for approximately 35% of global GDP at nominal value. Adjusted for purchasing power, the figure exceeds 50%. Meaning the world’s majority economic weight is systematically underrepresented in global capital markets.
• There is no universal definition of what emerging markets actually are. MSCI counts 24, FTSE Russell counts 23, the IMF counts 40. The index providers disagree with each other directly and the disagreements are getting more consequential.
Qatar has a GDP per capita of $77,000.[1] India has one of around $3,000.[2] According to the world’s leading index providers, they belong in the same category: emerging markets.
“In the 1980s, international business was essentially an exclusive club of the 20 richest countries. This changed as dictatorships and command economies collapsed throughout the world.“[3] Today the emerging markets as defined by MSCI have a combined GDP of around $44 trillion, which accounts for 35% of global GDP (2026 projections)[4]. Adjusted by purchasing power, it is almost 50%.[5]
A Label Born From Marketing
“Emerging markets” was originally invented in 1981 by Antoine van Agtmael, an employee at the International Finance Corporation who needed a better marketing term. The IMF had previously divided the world into two simple groups: wealthy industrial countries and poorer developing ones. Van Agtmael wanted neither label for the new equity fund he was trying to promote. But he had trouble finding interested investors for a "third-world equity fund“[6], so he coined something that evoked, as the IMF itself later noted, “dynamism, potential, and promise.” The name stuck. Within a decade it got adopted by major index providers like the MSCI Emerging Markets Equity Index in 1988 and JP Morgan’s Emerging Markets Bond Index in 1991. A marketing phrase had become an asset class.[7]
Van Agtmael was not the last to experience this. When Jim O’Neill, an English economist, coined the BRIC acronym in 2001 to describe Brazil, Russia, India, and China as the next major growth economies, the same thing happened. As the Financial Times later noted, "Like Mr. Agtmael, Goldman and Mr. O’Neill have little control of the Bric term as its popularity has spread."[8] O’Neill himself would later conclude that the “term ‘emerging markets‘ [was] no longer helpful because it encompassed countries with too great a range of economic prospects.“[8] A label invented for a specific analytical purpose takes on a life of its own, attracting capital, shaping indices, and defining the flow of billions of dollars long after its original meaning has been stretched beyond recognition.
Inside the Index
There is not even a universal consensus on what the term means to begin with. In 2008, the economist Vladimir Kvint offered the following definition: "a comfortable and attractive environment for global business, foreign investment, and international trade. […] an emerging market country can be defined as a society transitioning from a dictatorship to a free market-oriented economy, with increasing economic freedom, gradual integration within the global marketplace, an expanding middle class, improving standards of living and social stability and tolerance, as well as an increase in cooperation with multilateral institutions."[9] By this definition more than 80 countries would have been classified as emerging in 2021. Yet even this definition is leaving room for speculation. Kvint himself identified the root cause: the disagreements between the index providers “are the result of a lack of a real definition of emerging market countries and the absence in all Bretton Woods Institutions (The World Bank, International Monetary Fund, and economic branches of the U.N.) of a clearly defined category of these countries.“[9]
The numbers reflect this. MSCI classifies 24 countries as emerging markets, FTSE Russell classifies 23, and the IMF World Economic Outlook classifies 40 countries as emerging and middle-income.[10] While a particular index provider might move a country to the developed section, another index provider still classifies it as an emerging country. The leading index providers disagree with each other directly. While FTSE Russell classifies South Korea and Poland as developed countries, MSCI still classifies both as emerging as of March 2026.[11][12] S&P Global considers South Korea developed but Poland still emerging.[13]
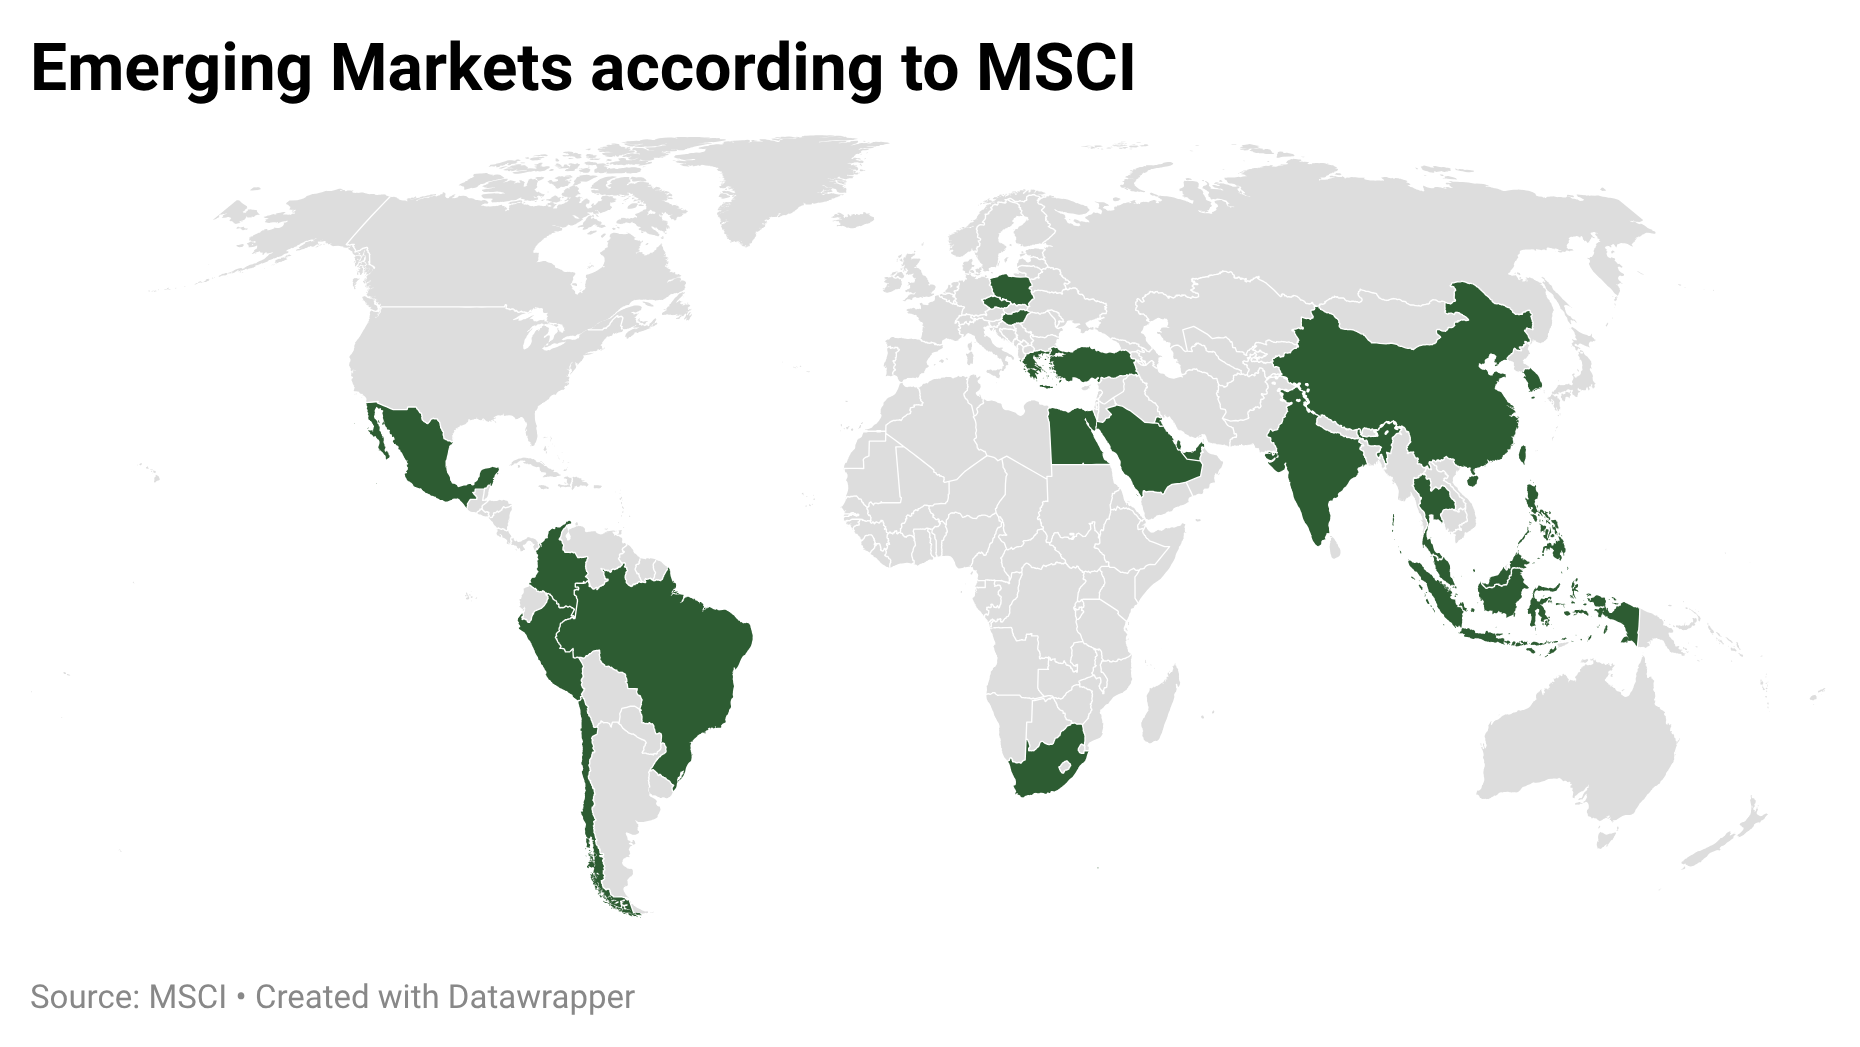
While there is no unanimous classification, the MSCI Emerging Markets Index is the most widely used. It originally started with 10 countries in 1988 and has grown to 24.[14] It currently includes China, India, Brazil, South Korea, Taiwan, Saudi Arabia, and eighteen other countries. Taiwan has a GDP per capita of $41,490 (2026)[15], which is higher than the developed country Spain at $40,580[16]. Shanghai and Shenzhen have skylines, infrastructure, and financial markets that rival any city in the northern hemisphere. These countries share a label with economies where the majority of the population has never had a bank account.
The gap between the poorest and richest countries inside this category has not narrowed over time but instead grown. While the Philippines' GDP per capita was $722 in 1988[17], Greece was the richest with $7,492[18]. This was a gap of roughly 10 times. Today India has the lowest GDP per capita with $3,050 (2026 projections)[19] and Qatar the highest with $77,000 (2025)[1]. That is a multiple of around 25 times. It is the same label, but more than double the range it covers.
South Korea is a striking example of how market accessibility can override economic reality. Despite having a GDP per capita comparable to Southern Europe and technology companies competing directly with Silicon Valley, South Korea has been stuck on MSCI’s emerging markets list for decades. The country was first placed on the watch list for a potential upgrade to developed status in 2009. Then again, removed in 2014 without promotion. The reason was not poverty. The limited convertibility of the Korean won in the offshore currency market remained a key barrier, alongside restrictions on currency trading hours and limited availability of financial instruments.[20] South Korea remains classified as emerging, not because of its wealth or development, but because trading is less frictionless than in the developed world.
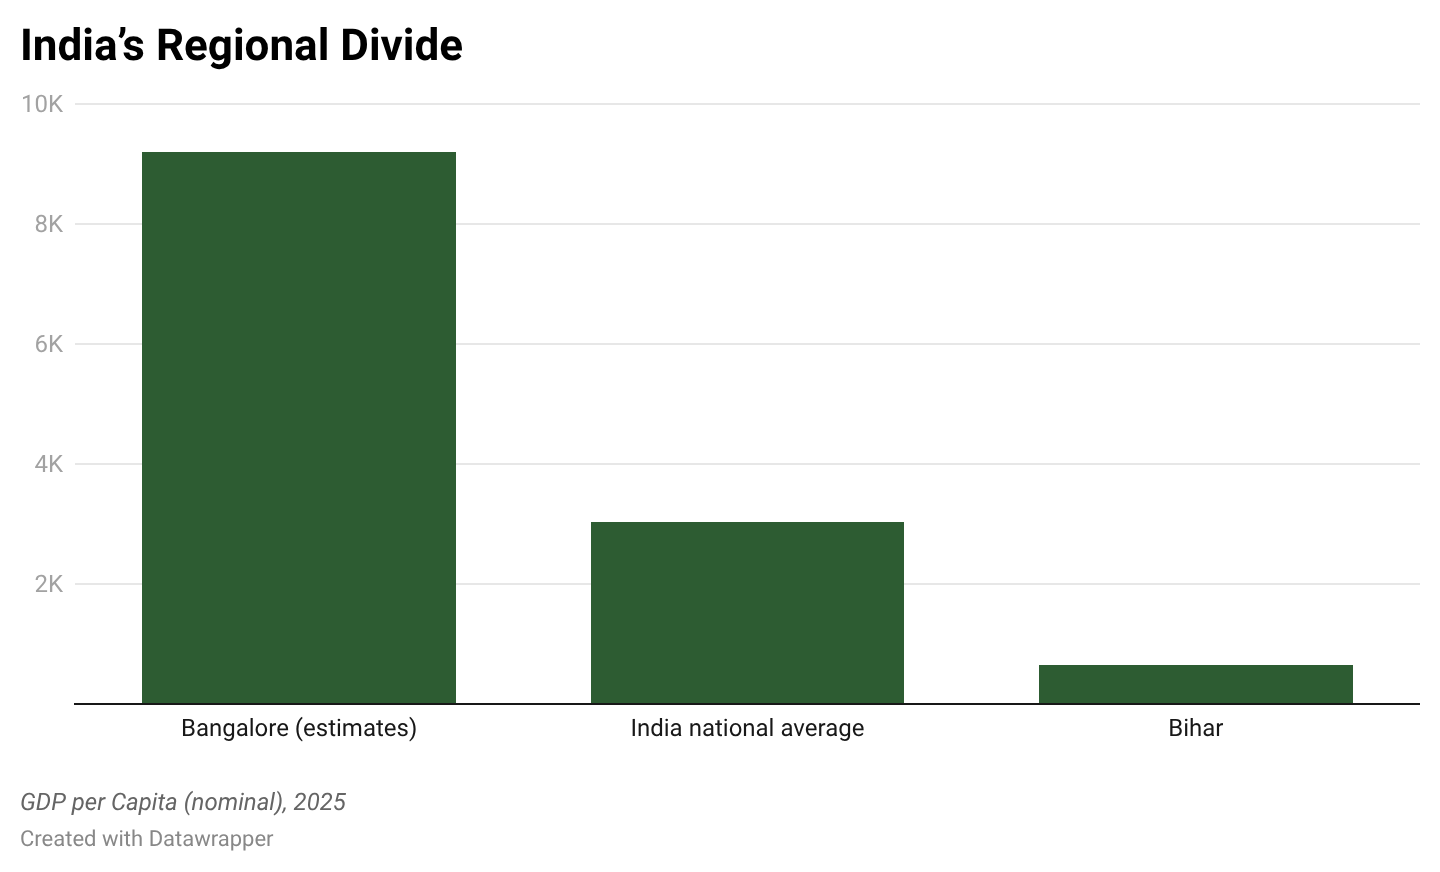
South Korea exposes the external limits of the classification. India exposes the internal ones. India is the largest country by population and also the fastest-growing economy in the world, with over 6% growth in 2025. India, with an expected GDP of $4.51 trillion (2026), is the fourth largest economy in the world, yet its GDP per capita is a mere $3,030.[19]
Bangalore is the innovation hub of India, its own Silicon Valley. It is the 3rd fastest-growing global wealth hub with a millionaire growth of 120% (2014-2024),[21] housing over 400 R&D facilities and 4000 startups.[22] Mumbai is one of the world‘s major financial hubs. Yet while cities like Bangalore and Mumbai are rapidly growing, most of the country is being left behind. Bihar, one of India‘s most populous states, has a GDP per capita of around $650.[23] This is below the figures for Sierra Leone, one of the poorest countries on earth.[24] What GDP figures also fail to capture is the vast informal economy that sits beneath the surface, whose output is only partially reflected in official statistics. In many emerging markets this hidden layer represents a significant share of actual economic activity. “The informal economy is a lifeline for millions worldwide. It’s a vibrant mix of jobs, small businesses, and economic activities that thrive beyond formal regulations, fueled by a dynamic and entrepreneurial spirit. Yet, this vital force is often overlooked in the global discourse on economic growth.“ [25] It is estimated that about 2 billion workers (over 60% of the adult workforce) operate in the informal sector, at least part-time.[26]
The same countries the index has struggled to classify are now driving the infrastructure that the global AI revolution depends on.
The countries inside this category are not waiting to arrive. Emerging markets supply the semiconductors, critical minerals, manufacturing capacity, and increasingly the cloud infrastructure that the AI revolution depends on. Taiwan’s semiconductor exports grew more than 50% year over year as of late 2025. South Korea supplies the high-bandwidth memory inside every AI server being built. The asset class the world once overlooked is now the backbone that the most advanced technology on earth runs on.[27]
Why the Label Persists
A new term was coined at the IFC in 1992 by Fariada Khambata: Frontier Markets, understood as a subset still below Emerging Markets on the classification ladder.[28] A country sitting on that lower step would be Estonia. Ranked the most digitalized country in the world, a eurozone member, with a GDP per capita of $37,000, more than ten times that of India, and a Human Development Index (HDI) of 0.905, it sits in the frontier markets category of MSCI, S&P Global, and FTSE Russell simultaneously.[29][30] Not because of any failure of development, institutions, or governance. But because its stock market is too small for large institutional investors to trade in without moving prices.[31] The classification has nothing to do with how developed the country is. It has everything to do with how conveniently Western capital can flow through it.
Emergence is no one-way street. While there is a general trend of global development, countries can take decades progressing from emerging to developed status, might never reach it, or can even experience decline. Greece was once classified as a developed market. In 2013 it became the first developed country ever to be downgraded to emerging status after its stockmarket fell 91 percent.[32] It is now being upgraded back to its developed status more than a decade later: by FTSE Russell effective September 2026 and by MSCI effective May 2027.[33][34] The same country, just three different classifications in fifteen years.
The label does something more insidious than misclassify. It implies that every country on the list has what it takes to arrive at developed status one day. That assumption is not just analytically questionable. For many of the 24 countries on the MSCI list, it may simply be untrue.
The current system imagines a ladder: developing, frontier, emerging, and developed that countries climb over time. Greece has climbed it, fallen off it, and currently climbing back up again. South Korea has been stuck on the same rung for decades despite being wealthier than most of Southern Europe. Estonia sits below India on that ladder not because it is less developed but because its stock market is too small to be convenient.
The question is not whether the label is broken. It clearly is. The question is rather why no alternative has replaced it. It persists because trillions of dollars are tied to it and changing it would be expensive and inconvenient.
That is why Understory Markets exists. Not to produce better labels. But to go beneath them, to find the founders, the operators, and the economists who understand these economies from the inside rather than from a classification built in 1981. Understory Markets is attempting to bring back intelligence from the ground up.
Thoughts, disagreements, and remarks are welcome. hello@understorymarkets.com
Sources
[1]: https://data.worldbank.org/indicator/NY.GDP.PCAP.CD?locations=QA
[2]: https://www.imf.org/external/datamapper/profile/IND
[3]: https://www.forbes.com/2008/01/28/kvint-developing-countries-oped-cx_kv_0129kvint.html
[5]: https://www.worldeconomics.com/Regions/Emerging-Markets/
[7]: https://www.imf.org/en/publications/fandd/issues/2024/09/emerging-markets-on-the-global-stage-aslam-petya-koeva
[8]: https://www.ft.com/content/f717c8e8-21be-11e0-9e3b-00144feab49a#ixzz1MKbbO8ET
[9]: https://www.forbes.com/2008/01/28/kvint-developing-countries-oped-cx_kv_0129kvint.html
[12]: https://www.msci.com/indexes/index-resources/market-classification
[14]: https://meketa.com/wp-content/uploads/2022/01/MEKETA_Emerging-Markets.pdf
[15]: https://www.imf.org/external/datamapper/profile/TWN
[16]: https://www.imf.org/external/datamapper/profile/ESP
[17]: https://data.worldbank.org/indicator/NY.GDP.PCAP.CD?locations=PH
[18]: https://data.worldbank.org/indicator/NY.GDP.PCAP.CD?locations=GR
[19]: https://www.imf.org/external/datamapper/profile/IND
[20]: https://www.koreaherald.com/article/10517141
[22]: https://india.diplo.de/in-de/ueber-uns/bangalore/2678932-2678932
[23]: https://statisticstimes.com/economy/india/bihar-economy.php
[25]: https://www.weforum.org/stories/2024/10/sustainable-growth-emerging-markets-informal-economy/
[28]: https://www.investopedia.com/terms/f/frontier-market.asp
[29]: https://www.imf.org/external/datamapper/profile/EST
[30]: https://www.theglobaleconomy.com/Estonia/human_development/